

FinOps EVM by Anderson Candido Oliveira is licensed under CC BY-NC 4.0![]()
![]()
![]()
This article is a compilation of my main writings about Earned Value Management approach to FinOps, that I’m calling FinOps EVM. This article contains all necessary content to get started with this technique Find all my individual articles searching for the tag EVM in this blog.
- Introduction
- Where EVM fits in FinOps
- What is EVM?
- Origins of EVM
- Key Components of EVM
- Adapting EVM to FinOps
- Recognizing the Differences
- Applying EVM Concepts
- Assumptions
- Earned Value, % Complete and Unit Economics
- Calculating Earned Value Management.
- Estimating EVM accurately
- Cost Performance Indicator
- Why FinOps EVM CPI Matters
- Applying FinOps EVM CPI to Cloud FinOps
- Challenges and Considerations on CPI
- Estimating FinOps EVM accurately
- Other EVM Indicators:
- Conclusion
It is time to shift from Cost Savings to Business Value. The first matters, but our goal is the latter.
Introduction
Earned Value Management (EVM), a well-established technique in project management, can be effectively adapted to FinOps Cloud Cost Management. While EVM traditionally focuses on project execution, its principles can be harnessed to track, control, and forecast cloud costs. In this article, we explore how EVM can enhance financial visibility, optimize resource allocation, and align cloud spending with business objectives.
Where EVM fits in FinOps
As FinOps is a big discipline, it is important to deliniate where EVM fits in, considering the entire framework. EMV is a technique that should be considered within the realm of Quantify Business Value domain.
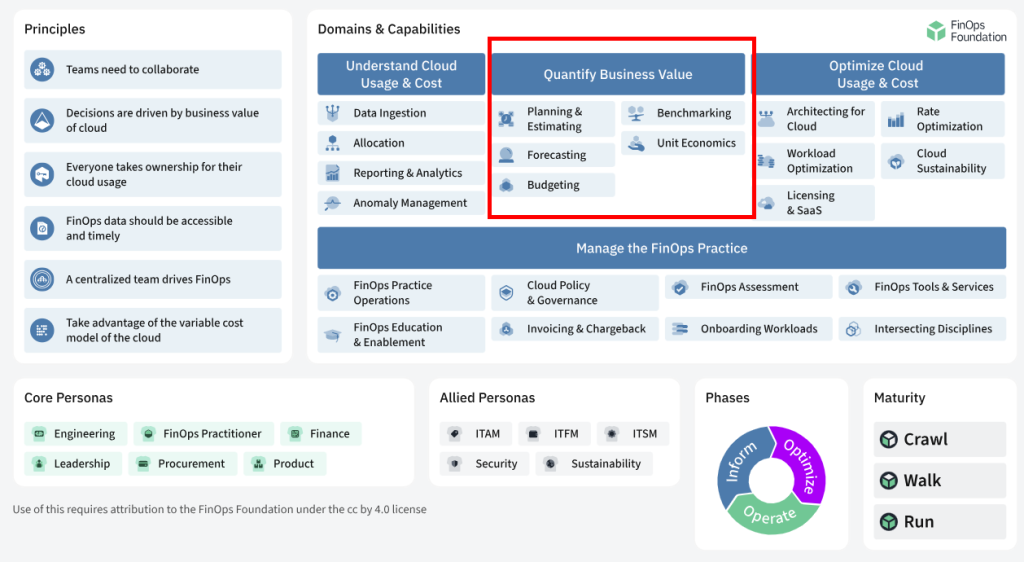
If we dig a little deeper at this domain, we will find the following definition.
If we dig a little deeper at this domain, we will find the following definition.
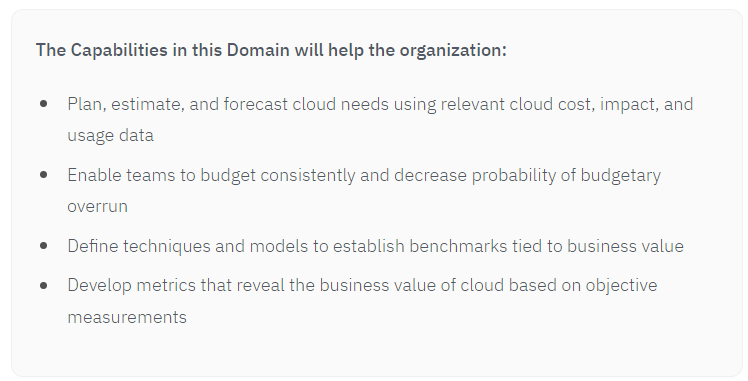
It is almost the description of EVM. When EVM first started, computing was on its first steps. But regardless of that, we will see that the technique still applies. The combination of EVM and FinOps can be of great value for the general ‘Quantify Business Value’ domain knowledge.
You make different colors by combining those colors that already exist. Herbie Hancock
What is EVM?
Earned Value Management (EVM) is a powerful project management technique that integrates cost, schedule, and performance metrics. It provides a holistic view of project progress by assessing the value of work accomplished against the planned budget and schedule. EVM enables project managers to make informed decisions, predict outcomes, and take corrective actions proactively.
Origins of EVM
EVM traces its roots back to the 1960s when it was initially developed by the U.S. Department of Defense for managing large defense projects. The technique gained prominence during the execution of complex projects such as the Polaris Missile Program. Since then, EVM has been widely adopted across various industries, including construction, engineering, software development, and information technology.

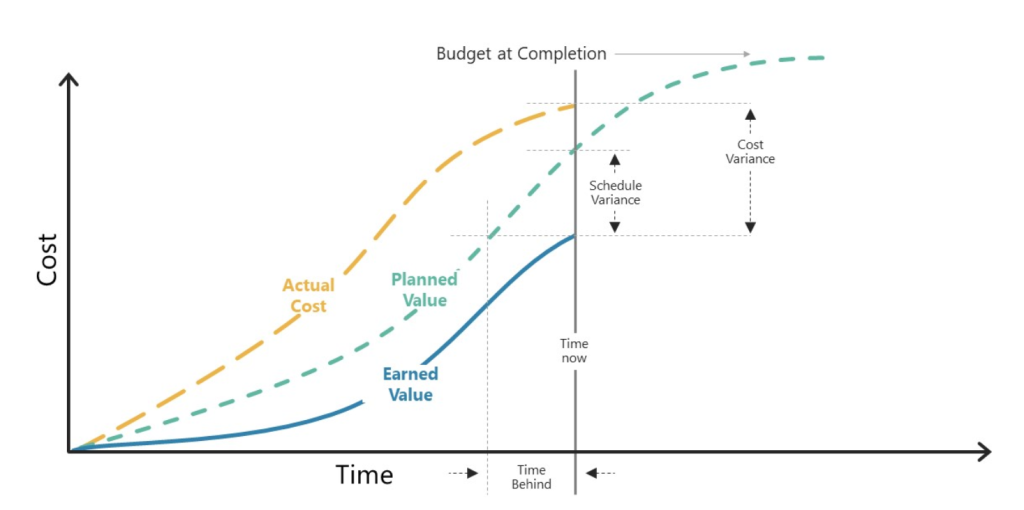
Key Components of EVM
- Planned Value (PV): PV represents the authorized budget allocated for the planned work. It is also known as the Budgeted Cost of Work Scheduled (BCWS). PV is established during project planning and reflects the cumulative cost of work scheduled up to a specific point in time.
- Earned Value (EV): EV signifies the value of work actually completed. It is also referred to as the Budgeted Cost of Work Performed (BCWP). EV is determined based on the completion status of project tasks or deliverables.
- Actual Cost (AC): AC represents the actual cost incurred for the work performed. It is also known as the Actual Cost of Work Performed (ACWP). AC is derived from financial records and reflects the real expenses associated with project execution.
Adapting EVM to FinOps
Recognizing the Differences
While EVM is a project management technique, FinOps deals with ongoing cloud operations. Here are some key differences:
- Time Span: EVM typically operates within project timelines, whereas FinOps spans an entire year or budget cycle.
- Percent Complete: In EVM, percent complete reflects project progress. In FinOps, it relates to planned vs. actual unit economics (e.g., cost per order).
Applying EVM Concepts
- Planned Value (PV): In FinOps, PV represents the budgeted cost for cloud resources over the year. It aligns with the annual budget plan.
- Earned Value (EV): EV corresponds to the actual value of cloud services consumed. Tracking EV helps measure progress against the budget.
- Actual Cost (AC): AC reflects the actual cloud spending. Comparing AC with EV provides insights into cost efficiency.
- Cost Performance Index (CPI): CPI indicates whether cloud spending is on track. A CPI < 1 suggests overspending. CPI = EV / AC
- Schedule Performance Index (SPI): SPI assesses the pace of cloud resource consumption. An SPI < 1 indicates inefficiencies. SPI = EV / PV
Assumptions
For an effective EVM calculation, we have to assume that the following artifacts are present.
- Well defined and understood Unit Economics. This is one of the Capabilities within the ‘Quantify Business Value’ domain. We assume that there is an Unit Economics target for the budgeting period. For example, X cost per order target for the year.
- An established Budget for the budgeting period. More specifically, a plan of how much you think you are going to spend on each time division within your budget cycle. I recommend that you have a monthly number if the budgeting cycle is yearly, to say the least. This budget or Plan Value (PV) is an output of the Budgeting and Planning & Estimating capabilities.
Earned Value, % Complete and Unit Economics
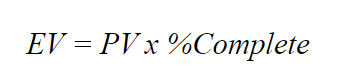
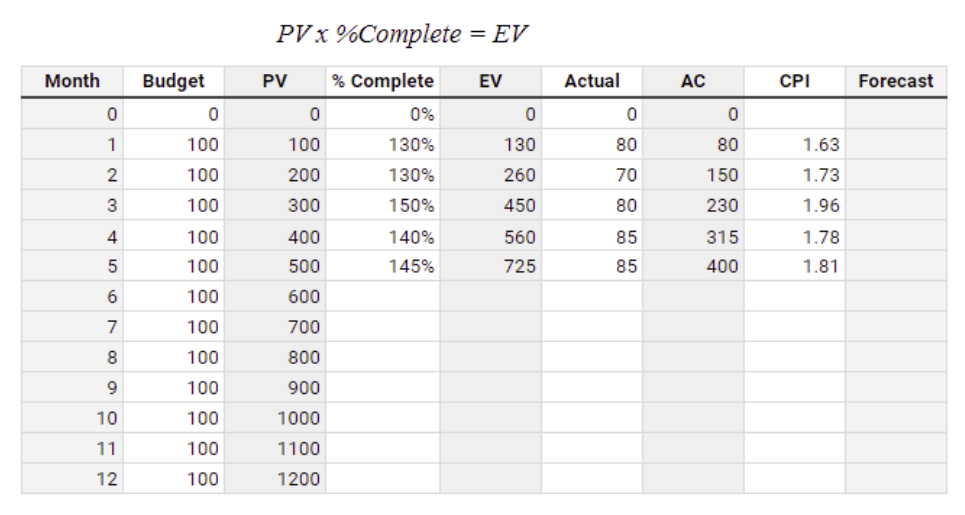
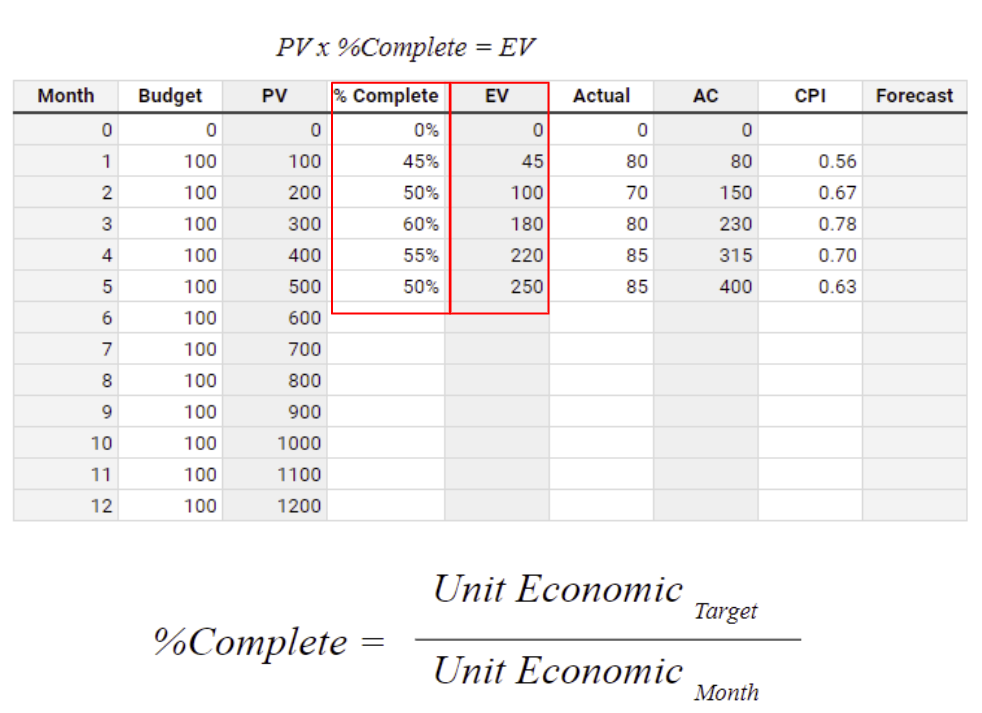
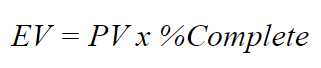
Earned Value (EV) is the result of Planned Value (PV) times %Complete. Remember that both EV and PV are cumulative for the assessing period. By assessing period, we mean the “the cumulative amount until the month we are doing the analysis”. For example, PV of March is the cumulative amount of the 3 first months of the year.
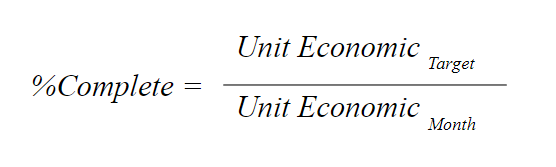
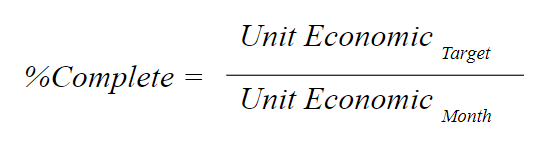
For FinOps, % Complete is the relation between Unit Economic on the assessing period with the target Unit Economic. For example, in March, our cumulative cost per order is $0.54 and our target cost per order is $0.50.
Calculating Earned Value Management.
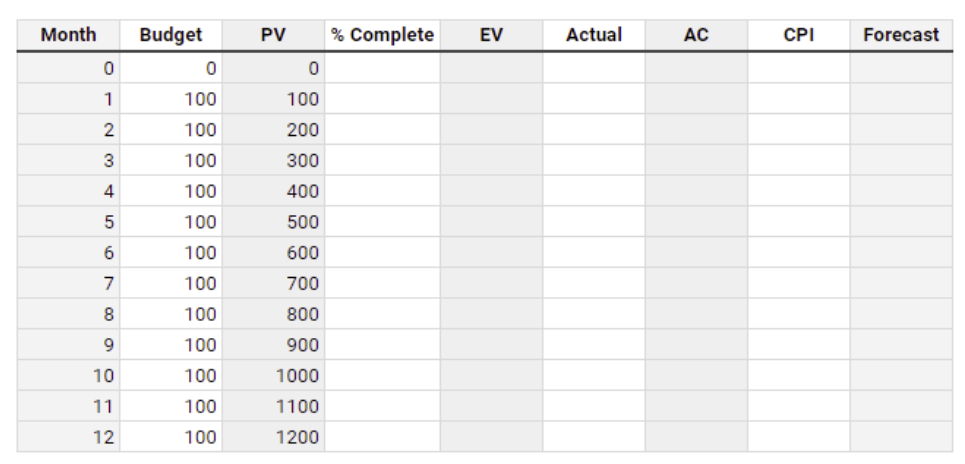
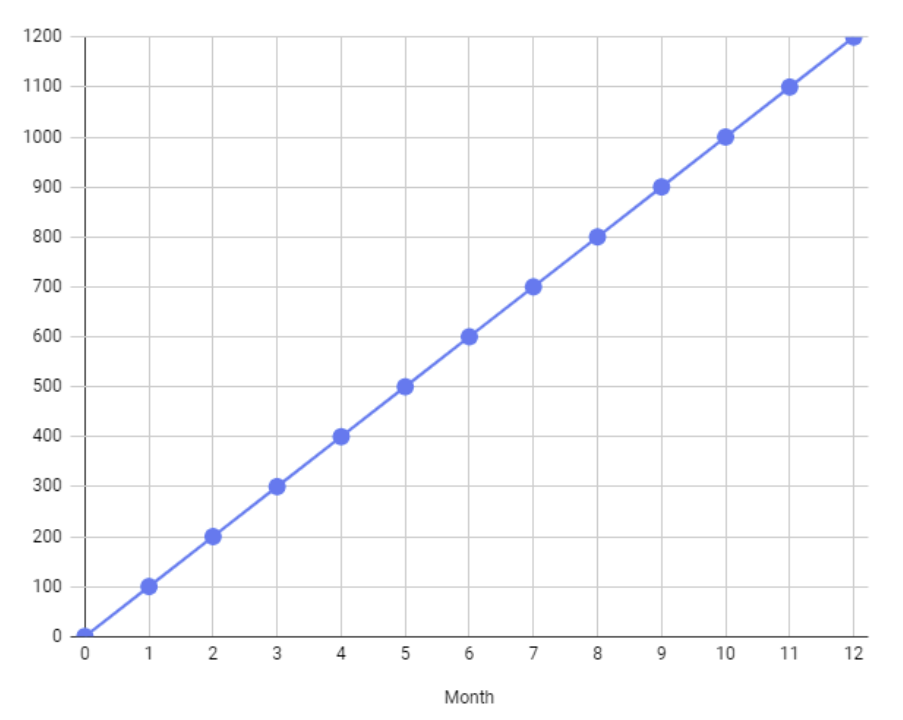
Let’s use a simple example to demonstrate how this can be calculated. Consider a budgeting cycle of a year, starting in January and finishing in December. For simplicity, consider that the monthly spend is estimated at $100 flat. PV is the cumulative amount at any given month.
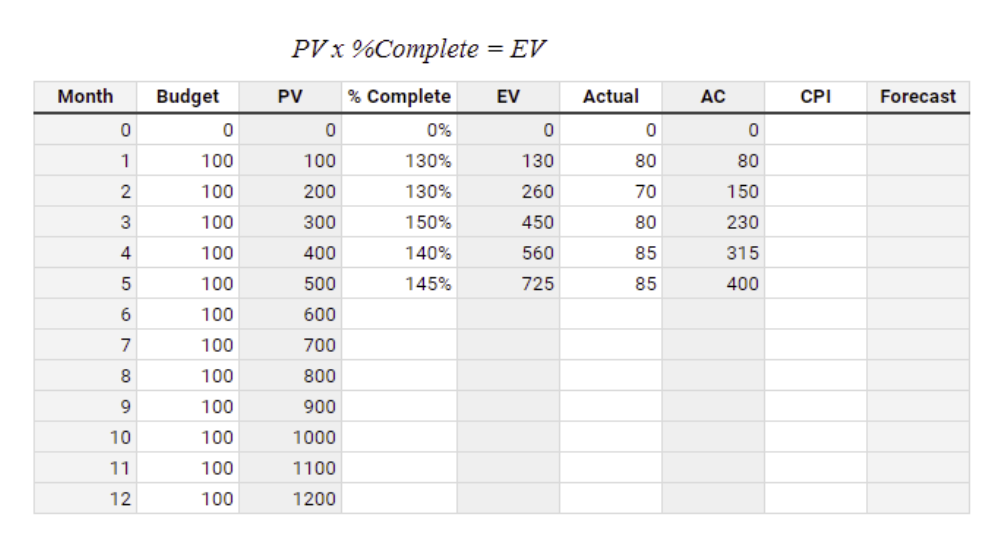
Scenario 1 – Under Budget.
Consider that we are assessing the month 5 (May) and that the calculated figures of %Complete, Actual Cost and cumulative Actual Cost (AC) are as follow:
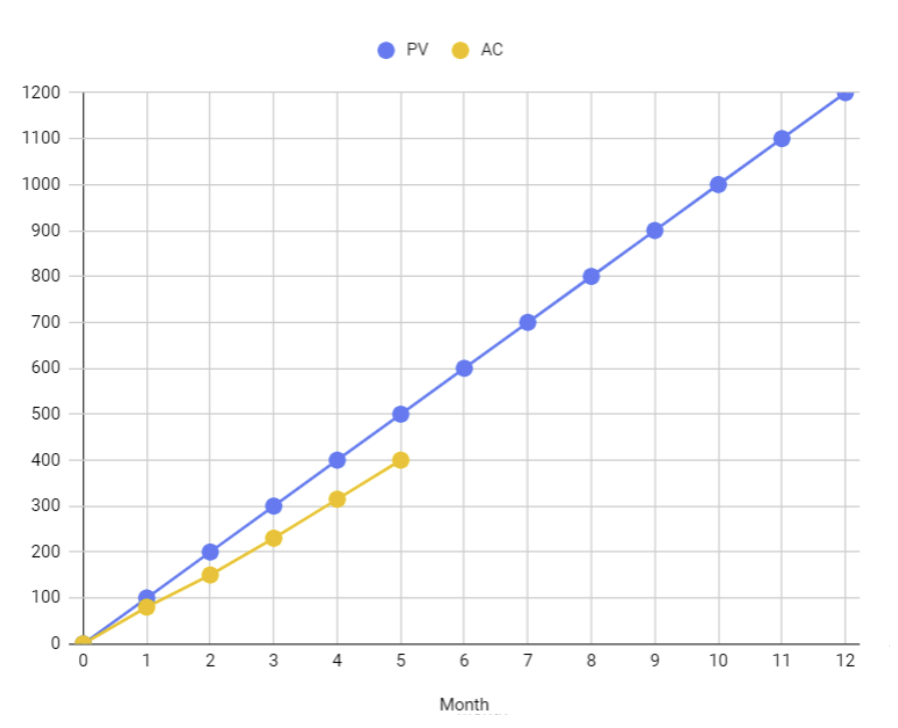
Let’s put these numbers in a graph and discuss it a little further.
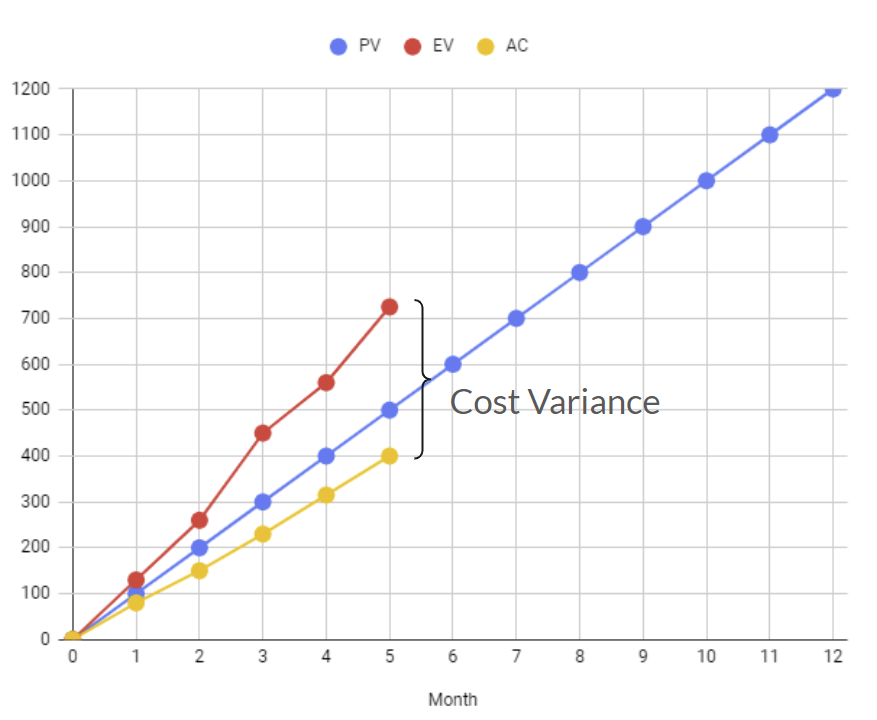
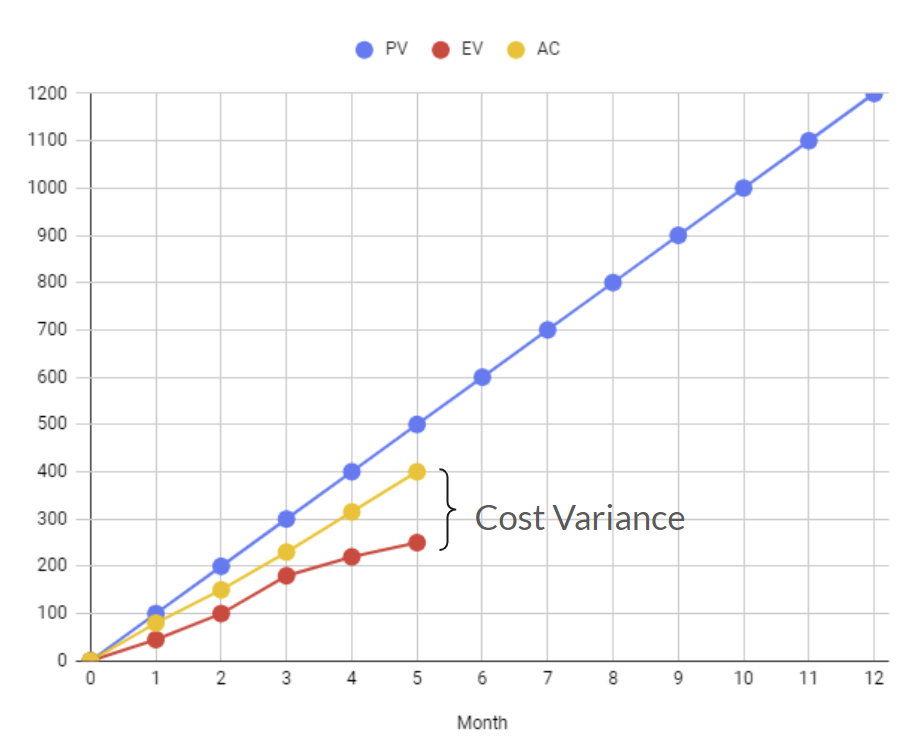
The cost variance is the difference between Earned Value and Actual Cost. This is the real value that we have earned up until that point in time.
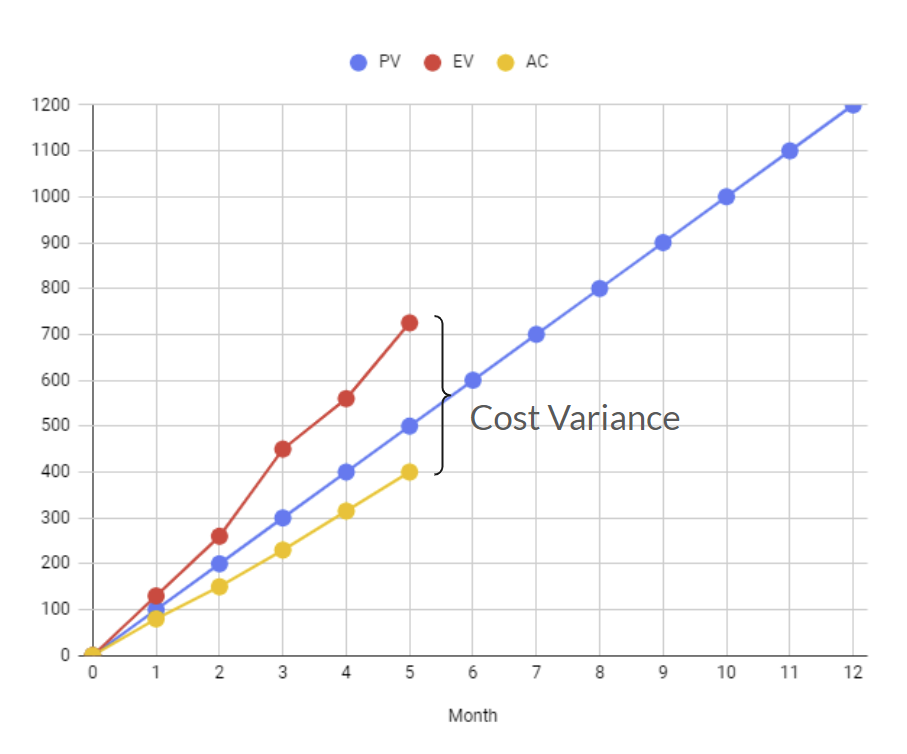
Cost Variance in this example, equals to $325. If Earned Value were not calculated, we would only have the normal comparison of Actuals vs. Plan, that would be $100. It is a good result, but not as good as the real situation is. Earned Value takes into consideration the business result by accounting expected and real Unit Economics.
Earned Value takes into consideration the business value by accounting expected and real Unit Economics.
Scenario 2 – Over Budget
Now let’s consider that, although PV and AC are the same, %Complete went differently, as unit economics were not according to what was expected.
If only Actuals and Plan were considered, we could be deceived by the apparent positive result of $25 under. But in reality, when we compare Actuals (AC) against Earned Value, we will see that we are actually $150 over. In other words a negative Cost Variance of -$150.
The conclusion of this scenario is that, although we are spending less than what was planned, we are not reaching the expected business value due to a negative cost variance.
Estimating EVM accurately
Accurate estimation of Earned Value (EV) is essential for effective Earned Value Management (EVM). Let’s break down the steps to estimate EV accurately:
Determine Percent Complete:
- This is the most important part. As seen on my previous article, in this technique, the percent complete will be tied to the Unit Economics.
- A target Unit Economic should be determined in advance. Normally it can be done as part of the budgeting exercise and should be reviewed on a periodic basis.
- Assess the Unit Economic for the reporting period. For more advanced teams, determine the Unit Economic specifically for the team. Determine what percentage compared with the target stablished for the team/product/area/etc. This step provides the foundation for calculating EV.
Planned Value (PV):
- PV represents the planned budget for the work completed up to a specific point in time. It’s the value of work that was scheduled to be done.
- On FinOps context, it is simply the budget amount for any given specific day, on the lowest level available.
Earned Value (EV):
- EV measures the actual value of what has been delivered from products and services on the cloud. It reflects the progress achieved.
- Earned Value (EV) is the result of Planned Value (PV) times %Complete. Remember that both EV and PV are cumulative for the assessing period. By assessing period, we mean the “the cumulative amount until the month we are doing the analysis”. For example, PV of March is the cumulative amount of the 3 first months of the year.
Actual Cost (AC):
- AC represents the actual cost incurred for the assessing period. Obtain this information from cloud billing data.
- AC is the total cost spent up to the current point in time.
- Make sure that AC comes from data that is correctly mapped within your reporting system. Also make sure that the period assessed contain the entire Actual cost, as some costs may take a few days to show on reports.
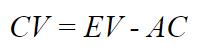
Cost Variance (CV):
- CV shows whether the project is under or over budget.
- Calculate CV using the formula:
CV = EV – AC
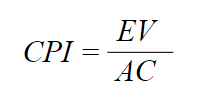
Cost Performance Indicator
Cost Performance Indicator (CPI) is obtained by dividing Earned Value (EV) by Actual Cost (AC).
If we apply this formula for the two scenarios, here is what we get:
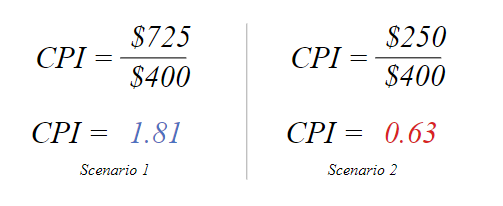
So, for Cost Performance Indicator, if:
- CPI is higher than 1, we are spending less to achieve business results.
- CPI is lower than 1, we are spending more and missing the target.
- CPI is equal 1, we are progressing according to the plan.
Turns out that CPI becomes a good indicator as with just one number we are able to know if our cloud spend is delivering the value expected.
Why FinOps EVM CPI Matters
Understanding EVM CPI
As mentioned above, CPI is a metric derived from Earned Value Management (EVM), a project management technique that integrates cost, schedule, and performance data. It provides insights into how efficiently a project or initiative is utilizing its budget. Specifically, EVM CPI compares the earned value (the value of work completed) to the actual cost incurred. The formula for EVM CPI is:
- If CPI > 1: The project is performing well within budget.
- If CPI = 1: The project is on budget.
- If CPI < 1: The project is over budget.
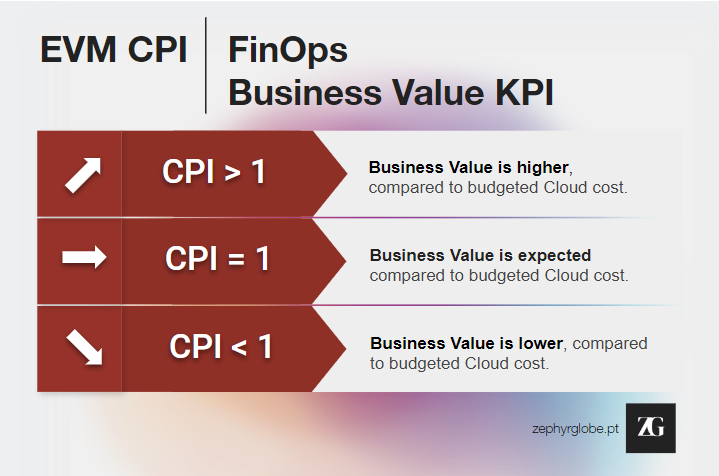
Translating the above to FinOps Business Value context:
- If CPI > 1: Business Value is higher, compared to budgeted Cloud cost.
- If CPI = 1: Business Value is expected compared to budgeted Cloud cost.
- If CPI < 1: Business Value is lower, compared to budgeted Cloud cost.
When executives finally grasp the concept of FinOps EVM CPI and truly understand its implications, they gain the power to instantly gauge the success or failure of a project or initiative in terms of delivering Business Value. The ability to swiftly evaluate current cloud spending is invaluable. The mere existence of this KPI, and its accurate calculation, signifies that the fundamental processes for managing cloud costs are, at the very least, in place to offer this concise measurement that empowers well-informed decisions.
Applying FinOps EVM CPI to Cloud FinOps
Cloud Cost Optimization
In the context of cloud computing, EVM CPI becomes a powerful tool for FinOps (Financial Operations) leaders. Here’s why:
- Cost Efficiency: EVM CPI helps organizations assess whether their cloud spending aligns with the value delivered. A high EVM CPI indicates efficient utilization of cloud resources, while a low EVM CPI signals potential waste or overspending.
- Resource Allocation: By tracking EVM CPI, leaders can allocate resources effectively. If a specific cloud service or workload consistently shows a low EVM CPI, it warrants investigation. Perhaps there’s an opportunity to optimize resource allocation or choose a more cost-effective solution.
Cloud Business Value Measurement
- Business Alignment: EVM CPI directly ties financial performance to business outcomes. Leaders can evaluate whether cloud investments are translating into tangible business value. For example, if a new feature deployment has a high EVM CPI, it suggests that the investment is paying off.
- Decision Making: EVM CPI informs strategic decisions. Leaders can prioritize projects based on their EVM CPI scores. Initiatives with a positive EVM CPI may receive additional funding, while those with a negative EVM CPI may require adjustments or reevaluation.
Challenges and Considerations on CPI
Data Accuracy
- Accurate data is essential for calculating EVM CPI. Leaders must ensure that cost and performance data are up-to-date and reliable. Here, the FinOps team has an important role to play, in order to ensure that the processes and practices are properly followed.
Contextual Interpretation
- EVM CPI should be interpreted in context. A low EVM CPI doesn’t automatically indicate failure; it might be acceptable if the project is in an early stage or if certain costs are front-loaded.
Estimating FinOps EVM accurately
Accurate estimation of Earned Value (EV) is essential for effective Earned Value Management (EVM). Let’s break down the steps to estimate EV accurately:
Determine Percent Complete:
- This is the most important part. On FinOps EVM the percent complete will be tied to the Unit Economics.
- A target Unit Economic should be determined in advance. Normally it can be done as part of the budgeting exercise and should be reviewed on a periodic basis.
- Assess the Unit Economic for the reporting period. For more advanced teams, determine the Unit Economic specifically for the team. Determine what percentage compared with the target stablished for the team/product/area/etc. This step provides the foundation for calculating EV.
Determine Planned Value (PV):
- PV represents the planned budget for the work completed up to a specific point in time. It’s the value of work that was scheduled to be done.
- On FinOps context, it is simply the budget amount for any given specific day, on the lowest level available.
Determine Earned Value (EV):
- EV measures the actual value of what has been delivered from products and services on the cloud. It reflects the progress achieved.
- Earned Value (EV) is the result of Planned Value (PV) times %Complete. Remember that both EV and PV are cumulative for the assessing period. By assessing period, we mean the “the cumulative amount until the month we are doing the analysis”. For example, PV of March is the cumulative amount of the 3 first months of the year.
Determine Actual Cost (AC):
- AC represents the actual cost incurred for the assessing period. Obtain this information from cloud billing data.
- AC is the total cost spent up to the current point in time.
- Make sure that AC comes from data that is correctly mapped within your reporting system. Also make sure that the period assessed contain the entire Actual cost, as some costs may take a few days to show on reports.
Other EVM Indicators:
- Besides CV and CPI, consider other indicators:
- Cost Performance Index (CPI): CPI = EV / AC
- Estimate at Completion (EAC): EAC estimates the total cost of budgeting period based on current performance.
- Estimate to Complete (ETC): ETC estimates the remaining cost needed to complete the budgeting period.
- Budget at Completion (BAC): Simply the total cost of the budget period.
- To-Complete Performance Index (TCPI): TCPI = (BAC – EV) / (BAC – AC)
- Schedule Variance (SV): CV = EV – PV. It is the cost of the actual schedule state (delayed or ahead of schedule).
Conclusion
Although the Earned Value Management (EVM) approach to FinOps that I’m proposing may sound new, the technique itself has been out there for many years. The terms like AC, EV and PV may not relate to the terms used in our day-to-day cloud cost management routine. But my intent on sticking to it is to allow everybody to take advantage of the enormous amount of posts, articles, videos and more that have been created about EVM throughout the years.
The good thing about FinOps EVM is that it condenses in a few indicators the real situation of cost compared to expected business results and quantifies it in monetary figures.
We have briefly introduced the Cost Performance Indicator (CPI), that is an effective way to put together, in just one number, the real actual spent compared to plan and business outcomes. Of course, it is not a magical number. It should be seen as it is: an indicator. A means to quickly assess the state of the affairs and trigger the necessary discussions.
Taking advantage of Earned Value Management at cloud FinOps comes with a price. At least early maturity in capabilities like Planning & Estimating, Budgeting and Unit Economics should be in place to enable the necessary inputs for proper Reporting and Analytics. Looking from a optmistic perspective though, FinOps EVM will come naturaly as a consequence of companies FinOps maturity evolution. It will enable senior leaders and all FinOps personas involved on the ‘Quantify Business Value’ domain to speak to the same values and work proactively towards the business goals.
FinOps EVM by Anderson Candido Oliveira is licensed under CC BY-NC 4.0![]()
![]()
![]()
Disclaimer: The information provided here is for educational purposes only. For specific advice related to your organization’s context, feel free to get in touch. 📊💡